Algebra Tutorials!
   
   
Home
Solving Quadratic Equations by Completing the Square
Graphing Logarithmic Functions
Division Property of Exponents
Adding and Subtracting Rational Expressions With Like Denominators
Rationalizing the Denominator
Multiplying Special Polynomials
Functions
Solving Linear Systems of Equations by Elimination
Solving Systems of Equation by Substitution and Elimination
Polynomial Equations
Solving Linear Systems of Equations by Graphing
Quadratic Functions
Solving Proportions
Parallel and Perpendicular Lines
Simplifying Square Roots
Simplifying Fractions
Adding and Subtracting Fractions
Solving Linear Equations
Inequalities in one Variable
Recognizing Polynomial Equations from their Graphs
Scientific Notation
Factoring a Sum or Difference of Two Cubes
Solving Nonlinear Equations by Substitution
Solving Systems of Linear Inequalities
Arithmetics with Decimals
Finding the Equation of an Inverse Function
Plotting Points in the Coordinate Plane
The Product of the Roots of a Quadratic
Powers
Solving Quadratic Equations by Completing the Square
Try the Free Math Solver or Scroll down to Tutorials!


Please use this form if you would like
to have this math solver on your website,
free of charge.


Solving Systems of Linear Inequalities

Example

Graph the system of inequalities.

y
y + 2 > x


Solution

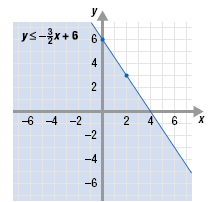
Step 1 Solve the first inequality for y. Then graph the inequality.

To graph the inequality first graph the equation

• The y-intercept is (0, 6). Plot (0, 6).

• The slope is To find a second point on the line, start at (0, 6) and move down 3 and right 2 to the point (2, 3). Plot (2, 3).

For the inequality the inequality symbol is “”. This stands for “is less than or equal to.”

• To represent “equal to,” draw a solid line through (0, 6) and (2, 3).

• To represent “less than,” shade the region below the line.

Note:

If you use the slope to plot several more points, it will be easier to draw the line.

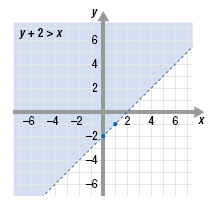
Step 2 Solve the second inequality for y. Then graph the inequality.

To solve for y, subtract 2 from both sides of y + 2 > x.

The result is y > x - 2.

To graph y > x - 2, first graph the equation y = x - 2.

• The y-intercept is (0, -2). Plot (0, -2).

• The slope is To find a second point on the line, start at (0, -2) and move up 1 and right 1 to the point (1, -1). Plot (1, -1).

For the inequality y > x - 2, the inequality symbol is “>”. This stands for “is greater than.”

• Since the inequality symbol “>” does not contain “equal to,” draw a dotted line through (0, -2) and (1, -1).

• To represent “greater than,” shade the region above the line.

Step 3 Shade the region where the two graphs overlap.

The solution is the region where the graphs overlap. This region contains the points that satisfy both inequalities.

As a check, choose a point in the solution region. For example, choose (0, 0).

To confirm that (0, 0) is a solution of the system, substitute 0 for x and 0 for y in each original inequalities and simplify.

  First inequality   Second inequality

y

Is

Is

≤ 6 ? Yes


Is

Is

y + 2

0 + 2

2

> x

> 0 ?

> 0 ? Yes

Since (0, 0) satisfies each inequality, it is a solution of the system.

Note:

The solution of the system is the set of all points in the dark shaded region, including the points on the line

Copyrights © 2005-2024